Observability
Observability
Archestra exposes Prometheus metrics and OpenTelemetry traces for monitoring system health, tracking HTTP requests, and analyzing LLM API performance.
Metrics
The web process exposes Prometheus-formatted metrics at http://localhost:9050/metrics.
When the separate worker deployment is enabled (ARCHESTRA_PROCESS_TYPE=worker, which is the default for Helm deployments), the worker process exposes its own metrics endpoint at http://<worker-host>:9000/metrics. Task queue metrics and background Knowledge Base pipeline metrics such as connector syncs and embedding batches are emitted from the worker process, so production scrape configs should collect both endpoints.
Combined, these endpoints expose metrics including:
LLM Metrics
llm_request_duration_seconds- LLM API request duration by provider, model, agent_id, agent_name, agent_type, source, and status codellm_tokens_total- Token consumption by provider, model, agent_id, agent_name, agent_type, source, and type (input/output)llm_cache_tokens_total- Prompt-cache tokens by provider, model, agent_id, agent_name, agent_type, source, and cache_type (read/write). Read is a reused prefix, write is a newly cached prefix; both are separate fromllm_tokens_totalso existing input/output aggregates are unaffected.llm_cost_total- Estimated cost in USD by provider, model, agent_id, agent_name, agent_type, and source. Requires token pricing to be configured in Archestra.llm_cache_cost_total- Estimated cost in USD attributable to prompt-cache tokens (reads plus writes, including the higher 1-hour-TTL write surcharge), by provider, model, agent_id, agent_name, agent_type, and source. Lets you chart caching spend separately from total cost.llm_cache_savings_total- Gross estimated USD saved by cache reads being billed at a discount versus the full input price, by provider, model, agent_id, agent_name, agent_type, and source. Read-side only (always non-negative); the signed net-of-write-surcharge savings is persisted per interaction rather than as a counter.llm_blocked_tools_total- Counter of tool calls blocked by tool invocation policies, grouped by provider, model, agent_id, agent_name, agent_type, and sourcellm_time_to_first_token_seconds- Time to first token (TTFT) for streaming requests, by provider, agent_id, agent_name, agent_type, source, and model. Helps developers choose models with lower initial response latency.llm_tokens_per_second- Output tokens per second throughput, by provider, agent_id, agent_name, agent_type, source, and model. Allows comparing model response speeds for latency-sensitive applications.
Note:
agent_idandagent_nameare the internal Archestra agent identifier and name. The external agent ID passed via theX-Archestra-Agent-Idheader is not a metric label (client-supplied values would create unbounded label cardinality); it is recorded on interactions and available in trace attributes asarchestra.external_agent_id.agent_typeindicates the type of agent:agent,llm_proxy,mcp_gateway, orprofile. Knowledge Base operations (embeddings, reranking) emit the same LLM metrics withagent_name="Knowledge Base"and emptyagent_id.
MCP Metrics
mcp_tool_calls_total- Total MCP tool calls by agent_id, agent_name, agent_type, mcp_server_name, tool_name, and status (success/error)mcp_tool_call_duration_seconds- MCP tool call execution duration by agent_id, agent_name, agent_type, mcp_server_name, tool_name, and statusmcp_server_deployment_status- Current deployment state of self-hosted MCP servers by server_name and state (not_created/pending/running/failed/succeeded). Value is 1 for the active state. Usecount(mcp_server_deployment_status{state="running"} == 1)to count running deployments.
RAG & Knowledge Base Metrics
rag_connector_syncs_total- Total connector syncs by connector_type and status (success/failed/partial)rag_connector_sync_duration_seconds- Connector sync duration by connector_type and statusrag_documents_processed_total- Total documents processed during syncs by connector_typerag_documents_ingested_total- Total documents ingested (new or updated) by connector_typerag_chunks_created_total- Total chunks created during document ingestion by connector_typerag_embedding_batches_total- Total embedding batches processed by status (success/error)rag_embedding_documents_total- Total documents embedded by statusrag_queries_total- Total RAG queries by search_type (vector/hybrid)rag_query_duration_seconds- RAG query end-to-end duration (embedding, search, rerank) by search_typerag_query_results_count- Number of results returned per RAG query by search_type
Note: Knowledge Base embedding and reranking LLM calls also emit standard LLM metrics (
llm_request_duration_seconds,llm_tokens_total,llm_cost_total) withsource="knowledge:embedding"orsource="knowledge:reranker"andagent_name="Knowledge Base". These appear in the GenAI Observability dashboard and can be filtered by source.
Task Queue Metrics
task_queue_tasks_enqueued_total- Total tasks enqueued by task_type (connector_sync, batch_embedding, check_due_connectors)task_queue_tasks_completed_total- Total tasks completed successfully by task_typetask_queue_tasks_failed_total- Total task processing failures (may be retried) by task_typetask_queue_tasks_dead_total- Total tasks moved to dead-letter (max retries exceeded) by task_typetask_queue_task_duration_seconds- Task processing duration by task_typetask_queue_active_tasks- Currently active (in-flight) tasks by task_typetask_queue_stuck_tasks_reset_total- Total stuck tasks reset back to pending
Archestra Application Metrics
HTTP Metrics
http_request_duration_seconds_count- Total HTTP requests by method, route, and statushttp_request_duration_seconds_bucket- Request duration histogram bucketshttp_request_summary_seconds- Request duration summary with quantiles
Process Metrics
process_cpu_user_seconds_total- CPU time in user modeprocess_cpu_system_seconds_total- CPU time in system modeprocess_resident_memory_bytes- Physical memory usageprocess_start_time_seconds- Process start timestamp
Node.js Runtime Metrics
nodejs_eventloop_lag_seconds- Event loop lag (latency indicator)nodejs_heap_size_used_bytes- V8 heap memory usagenodejs_heap_size_total_bytes- Total V8 heap sizenodejs_external_memory_bytes- External memory usagenodejs_active_requests_total- Currently active async requestsnodejs_active_handles_total- Active handles (file descriptors, timers)nodejs_gc_duration_seconds- Garbage collection timing by typenodejs_version_info- Node.js version information
Distributed Tracing
Archestra exports OpenTelemetry traces to help you understand request flows and identify performance bottlenecks. Traces can be consumed by any OTLP-compatible backend (Jaeger, Tempo, Honeycomb, Grafana Cloud, etc.).
Configuration
Configure the OpenTelemetry Collector endpoint via environment variable:
ARCHESTRA_OTEL_EXPORTER_OTLP_ENDPOINT=http://your-collector:4318
This base URL is used for both traces (/v1/traces) and logs (/v1/logs). If not specified, it defaults to http://localhost:4318.
Authentication
Archestra supports authentication for OTEL trace export through environment variables. Authentication is optional and can be configured using either basic authentication or bearer token authentication.
Bearer Token Authentication
Bearer token authentication takes precedence over basic authentication when both are configured:
ARCHESTRA_OTEL_EXPORTER_OTLP_AUTH_BEARER=your-bearer-token
This adds an Authorization: Bearer your-bearer-token header to all OTEL requests.
Basic Authentication
For basic authentication, both username and password must be provided:
ARCHESTRA_OTEL_EXPORTER_OTLP_AUTH_USERNAME=your-username
ARCHESTRA_OTEL_EXPORTER_OTLP_AUTH_PASSWORD=your-password
This adds an Authorization: Basic base64(username:password) header to all OTEL requests.
No Authentication
If none of the authentication environment variables are configured, traces will be sent without authentication headers.
Content Capture
Archestra can capture prompt/completion content and tool call arguments/results as span events for full audit trail visibility. This is enabled by default and can be disabled via the ARCHESTRA_OTEL_CAPTURE_CONTENT environment variable.
When enabled, traces include:
- LLM spans -
gen_ai.content.promptevent with the request messages, andgen_ai.content.completionevent with the response text - MCP spans -
gen_ai.content.inputevent with tool call arguments, andgen_ai.content.outputevent with tool call results
Content is truncated to 10,000 characters per event by default to avoid oversized spans. This limit is configurable via the ARCHESTRA_OTEL_CONTENT_MAX_LENGTH environment variable.
Metric-to-Trace Exemplars
All LLM and MCP metrics include trace exemplars. When viewing these metrics in Grafana, you can click on individual data points to jump directly to the corresponding trace in Tempo. This requires:
- Prometheus configured with
--enable-feature=exemplar-storage - Grafana Prometheus datasource configured with
exemplarTraceIdDestinationspointing to your Tempo datasource
Verbose Tracing
By default, traces only contain GenAI-specific spans (LLM calls, MCP tool calls) for a clean, focused view. To also capture internal infrastructure spans (HTTP routes, outgoing HTTP calls, Node.js fetch, etc), set the ARCHESTRA_OTEL_VERBOSE_TRACING environment variable to true. This is useful for debugging but produces significantly more spans.
When Sentry is configured, infrastructure auto-instrumentations are automatically enabled so that Sentry receives full traces for internal debugging. However, the customer-facing OTLP export is filtered to only include GenAI/MCP spans — customers see a clean trace view while Sentry gets the complete picture. Setting ARCHESTRA_OTEL_VERBOSE_TRACING=true disables this filtering, sending all spans to both Sentry and OTLP.
What's Traced
Archestra automatically traces:
- LLM API calls - Calls to LLM providers with dedicated spans showing model, tokens, and response time
- Knowledge Base operations - Embedding and reranking LLM calls made by the Knowledge Base system, with cost and token tracking
- MCP tool calls - Tool executions through the MCP Gateway with tool name, server, and duration
- Skill sandbox execution - The native Rust runtime behind Agent Skill execution exports its own spans (
service.name=archestra-sandbox-rs) — command runs, artifact reads, and container materialization — nested under the originating tool-call trace, withexit_code,duration_ms, and output size recorded as span fields - HTTP requests (verbose mode only) - All API requests with method, route, and status code
Trace attributes follow the OTEL GenAI Semantic Conventions where applicable.
LLM Request Spans
Each LLM API call produces a span with SpanKind.CLIENT (indicating an outbound call to an external LLM API) and includes detailed attributes for filtering and analysis:
Request Attributes:
route.category=llm-proxy- All LLM proxy requestsgen_ai.operation.name- The operation type (chat,generate_content)gen_ai.provider.name- Provider name (openai,anthropic,gemini, etc.)gen_ai.request.model- Model name (e.g.,gpt-4,claude-3-5-sonnet-20241022)gen_ai.request.streaming- Whether the request was streaming (true/false)server.address- Base URL of the LLM provider APIgen_ai.agent.id- Internal Archestra agent IDgen_ai.agent.name- Internal Archestra agent namegen_ai.conversation.id- Session ID for grouping related LLM calls (fromX-Archestra-Session-Idheader)archestra.agent.type- Agent type (agent,llm_proxy,mcp_gateway,profile)archestra.execution.id- Execution ID (fromX-Archestra-Execution-Idheader)archestra.external_agent_id- Client-provided agent ID (fromX-Archestra-Agent-Idheader)archestra.trigger.source- The source that triggered the LLM call (e.g.,knowledge:embedding,knowledge:reranker,model_router,api,chat). Useful for filtering traces by origin.archestra.agent.label.<key>- Custom agent labels (e.g.,archestra.agent.label.environment=production)archestra.agent.team.ids- IDs of the teams the agent belongs to (array-valued; an agent can belong to multiple teams)archestra.agent.team.names- Names of the teams the agent belongs to (array-valued)archestra.agent.team.label.<key>- Custom agent-team labels (array-valued). Values are merged per key across all of the agent's teams, e.g.,archestra.agent.team.label.environment=["production","staging"]archestra.user.team.ids- IDs of the teams the requesting user belongs to (array-valued)archestra.user.team.names- Names of the teams the requesting user belongs to (array-valued)archestra.user.team.label.<key>- Custom user-team labels, merged per key across the user's teams (array-valued)archestra.user.id- The Archestra user ID who made the request (when available)archestra.user.email- The Archestra user email (when available)archestra.user.name- The Archestra user display name (when available)
Response Attributes:
gen_ai.response.model- The model that actually generated the response (may differ from request model)gen_ai.response.id- Provider-assigned response IDgen_ai.usage.input_tokens- Number of input tokens consumed. Per the GenAI semantic conventions this includes cached tokens, so the uncached portion isinput_tokens - cache_read.input_tokens - cache_creation.input_tokens. (Note: thellm_tokens_total{type="input"}metric and stored cost are uncached-only by design, so they will read lower than this attribute when caching is active.)gen_ai.usage.output_tokens- Number of output tokens generatedgen_ai.usage.reasoning.output_tokens- Output tokens spent on reasoning / extended thinking (a subset ofgen_ai.usage.output_tokens). Reported by OpenAI (reasoning_tokens) and Gemini (thoughtsTokenCount); unset for providers that do not break reasoning tokens out separately.gen_ai.usage.total_tokens- Total tokens (input including cache + output)gen_ai.usage.cache_read.input_tokens- Prompt-cache tokens served from a provider cache, a subset ofinput_tokens(set only when the response read from cache)gen_ai.usage.cache_creation.input_tokens- Prompt-cache tokens written to a provider cache, a subset ofinput_tokens(set only when the response cached a prefix)archestra.usage.cache_creation.1h_input_tokens- Portion of cache-creation tokens written at the 1-hour TTL (Anthropic/Bedrock), billed at a higher surcharge than the 5-minute default. Uses thearchestra.*namespace because the GenAI semantic conventions have no per-TTL breakdown. The remainder ofgen_ai.usage.cache_creation.input_tokensis the 5-minute portion.archestra.cost- Estimated cost in USD (requires model pricing configuration)gen_ai.response.finish_reasons- Why the model stopped generating (e.g.,["stop"],["tool_calls"],["end_turn"])
Error Attributes:
error.type- The error class name when an exception occurs during the LLM call
Span Names:
Span names follow the GenAI semconv format {operation} {model}:
chat gpt-4o-mini- OpenAI, Anthropic, Cohere, and other chat-based providersgenerate_content gemini-2.0-flash- Gemini content generation calls
MCP Tool Call Spans
Each MCP tool call executed through the MCP Gateway produces a dedicated span:
Span Attributes:
route.category=mcp-gateway- All MCP Gateway tool callsgen_ai.operation.name=execute_tool- Operation typegen_ai.tool.name- The full tool name (e.g.,github__list_repos)gen_ai.tool.type=function- Tool type (all MCP tools are function-type)gen_ai.tool.call.id- Unique identifier for this tool call invocationmcp.server.name- The MCP server handling the tool call (e.g.,github,slack)gen_ai.agent.id- Internal Archestra agent IDgen_ai.agent.name- Internal Archestra agent namegen_ai.conversation.id- Session ID (when available)archestra.agent.type- Agent typearchestra.agent.label.<key>- Custom agent labelsarchestra.agent.team.ids- IDs of the teams the agent belongs to (array-valued)archestra.agent.team.names- Names of the teams the agent belongs to (array-valued)archestra.agent.team.label.<key>- Custom agent-team labels, merged per key across the agent's teams (array-valued)archestra.user.team.ids- IDs of the teams the requesting user belongs to (array-valued)archestra.user.team.names- Names of the teams the requesting user belongs to (array-valued)archestra.user.team.label.<key>- Custom user-team labels, merged per key across the user's teams (array-valued)archestra.user.id- The Archestra user ID (when available)archestra.user.email- The Archestra user email (when available)archestra.user.name- The Archestra user display name (when available)mcp.blocked- Whether the tool call was blocked by a tool invocation policy (true/false). Whentrue, the tool was never executed — the span represents the policy decision. Blocked tool spans have span status ERROR with the blocked reason as the status message.mcp.blocked_reason- Human-readable reason why the tool call was blocked (only present whenmcp.blocked=true). Possible values include policy-specific reasons (e.g., "Tool invocation blocked: policy is configured to always block tool call"), untrusted context reasons, or custom reasons configured on individual policies.mcp.is_error_result- Whether the tool returned an error result (true/false). This is distinct from span status ERROR, which indicates an exception during execution. Only present on executed (non-blocked) tool calls.error.type- The error class name when an exception occurs during tool execution
Span Names:
execute_tool {tool_name}- e.g.,execute_tool github__list_repos
Knowledge Base Spans
Knowledge Base embedding and reranking LLM calls produce spans with the same structure as LLM proxy spans. These calls bypass the LLM proxy (they call provider APIs directly), but are instrumented with the same OTEL tracing, Prometheus metrics, and interaction recording.
Key differences from proxy LLM spans:
gen_ai.agent.idandgen_ai.agent.nameare not set (KB calls are not tied to a profile)archestra.trigger.sourceis set toknowledge:embeddingorknowledge:reranker- Prometheus metrics use
agent_name="Knowledge Base"as a synthetic label
Span Names:
embedding text-embedding-3-small- Embedding API callschat {model}- Reranker LLM calls (uses chat completion for relevance scoring)
Session Tracking
Archestra supports session-based grouping of LLM and tool call traces via the gen_ai.conversation.id attribute. Pass a session ID via the X-Archestra-Session-Id header in your LLM proxy requests to group all related traces together. This enables viewing the full timeline of LLM calls and tool executions within a single agent session.
Chat Traces
When using the built-in chat feature, each chat turn produces a unified trace that groups LLM calls and MCP tool executions under a single parent span:
chat {agentName}                       ← parent span (SpanKind.SERVER)
├── chat {model}                       ← LLM call via proxy (SpanKind.CLIENT)
├── execute_tool {tool_name}           ← MCP tool execution
└── chat {model}                       ← follow-up LLM call after tool result
The parent span (route.category=chat) carries the agent identity and session ID. LLM proxy calls from chat are linked via W3C traceparent header propagation, so the LLM spans appear as children rather than independent root traces. MCP tool executions run within the same async context and are automatically parented.
This same unified tracing applies to all agent invocation paths:
| Invocation Path | route.category | archestra.trigger.source |
|---|---|---|
| Chat UI | chat | — |
| A2A Protocol | a2a | — |
| MS Teams | chatops | ms-teams |
email | email |
The archestra.trigger.source span attribute lets you filter traces by invocation channel (e.g., find all agent executions triggered from MS Teams).
External LLM proxy calls produce independent root traces.
Custom Agent Labels
Labels are key-value pairs that can be configured when creating or updating agents through the Archestra UI. Use them, for example, to logically group agents by environment or application type. Once added, labels automatically appear in:
- Metrics - As additional label dimensions on all LLM and MCP metrics. Use them to drill down into charts. Note that
kebab-caselabels will be converted tosnake_casehere because of Prometheus naming rules. - Traces - As
archestra.agent.label.<key>span attributes. Use them to filter traces.
Grafana Dashboards
We provide five Grafana dashboards for monitoring Archestra:
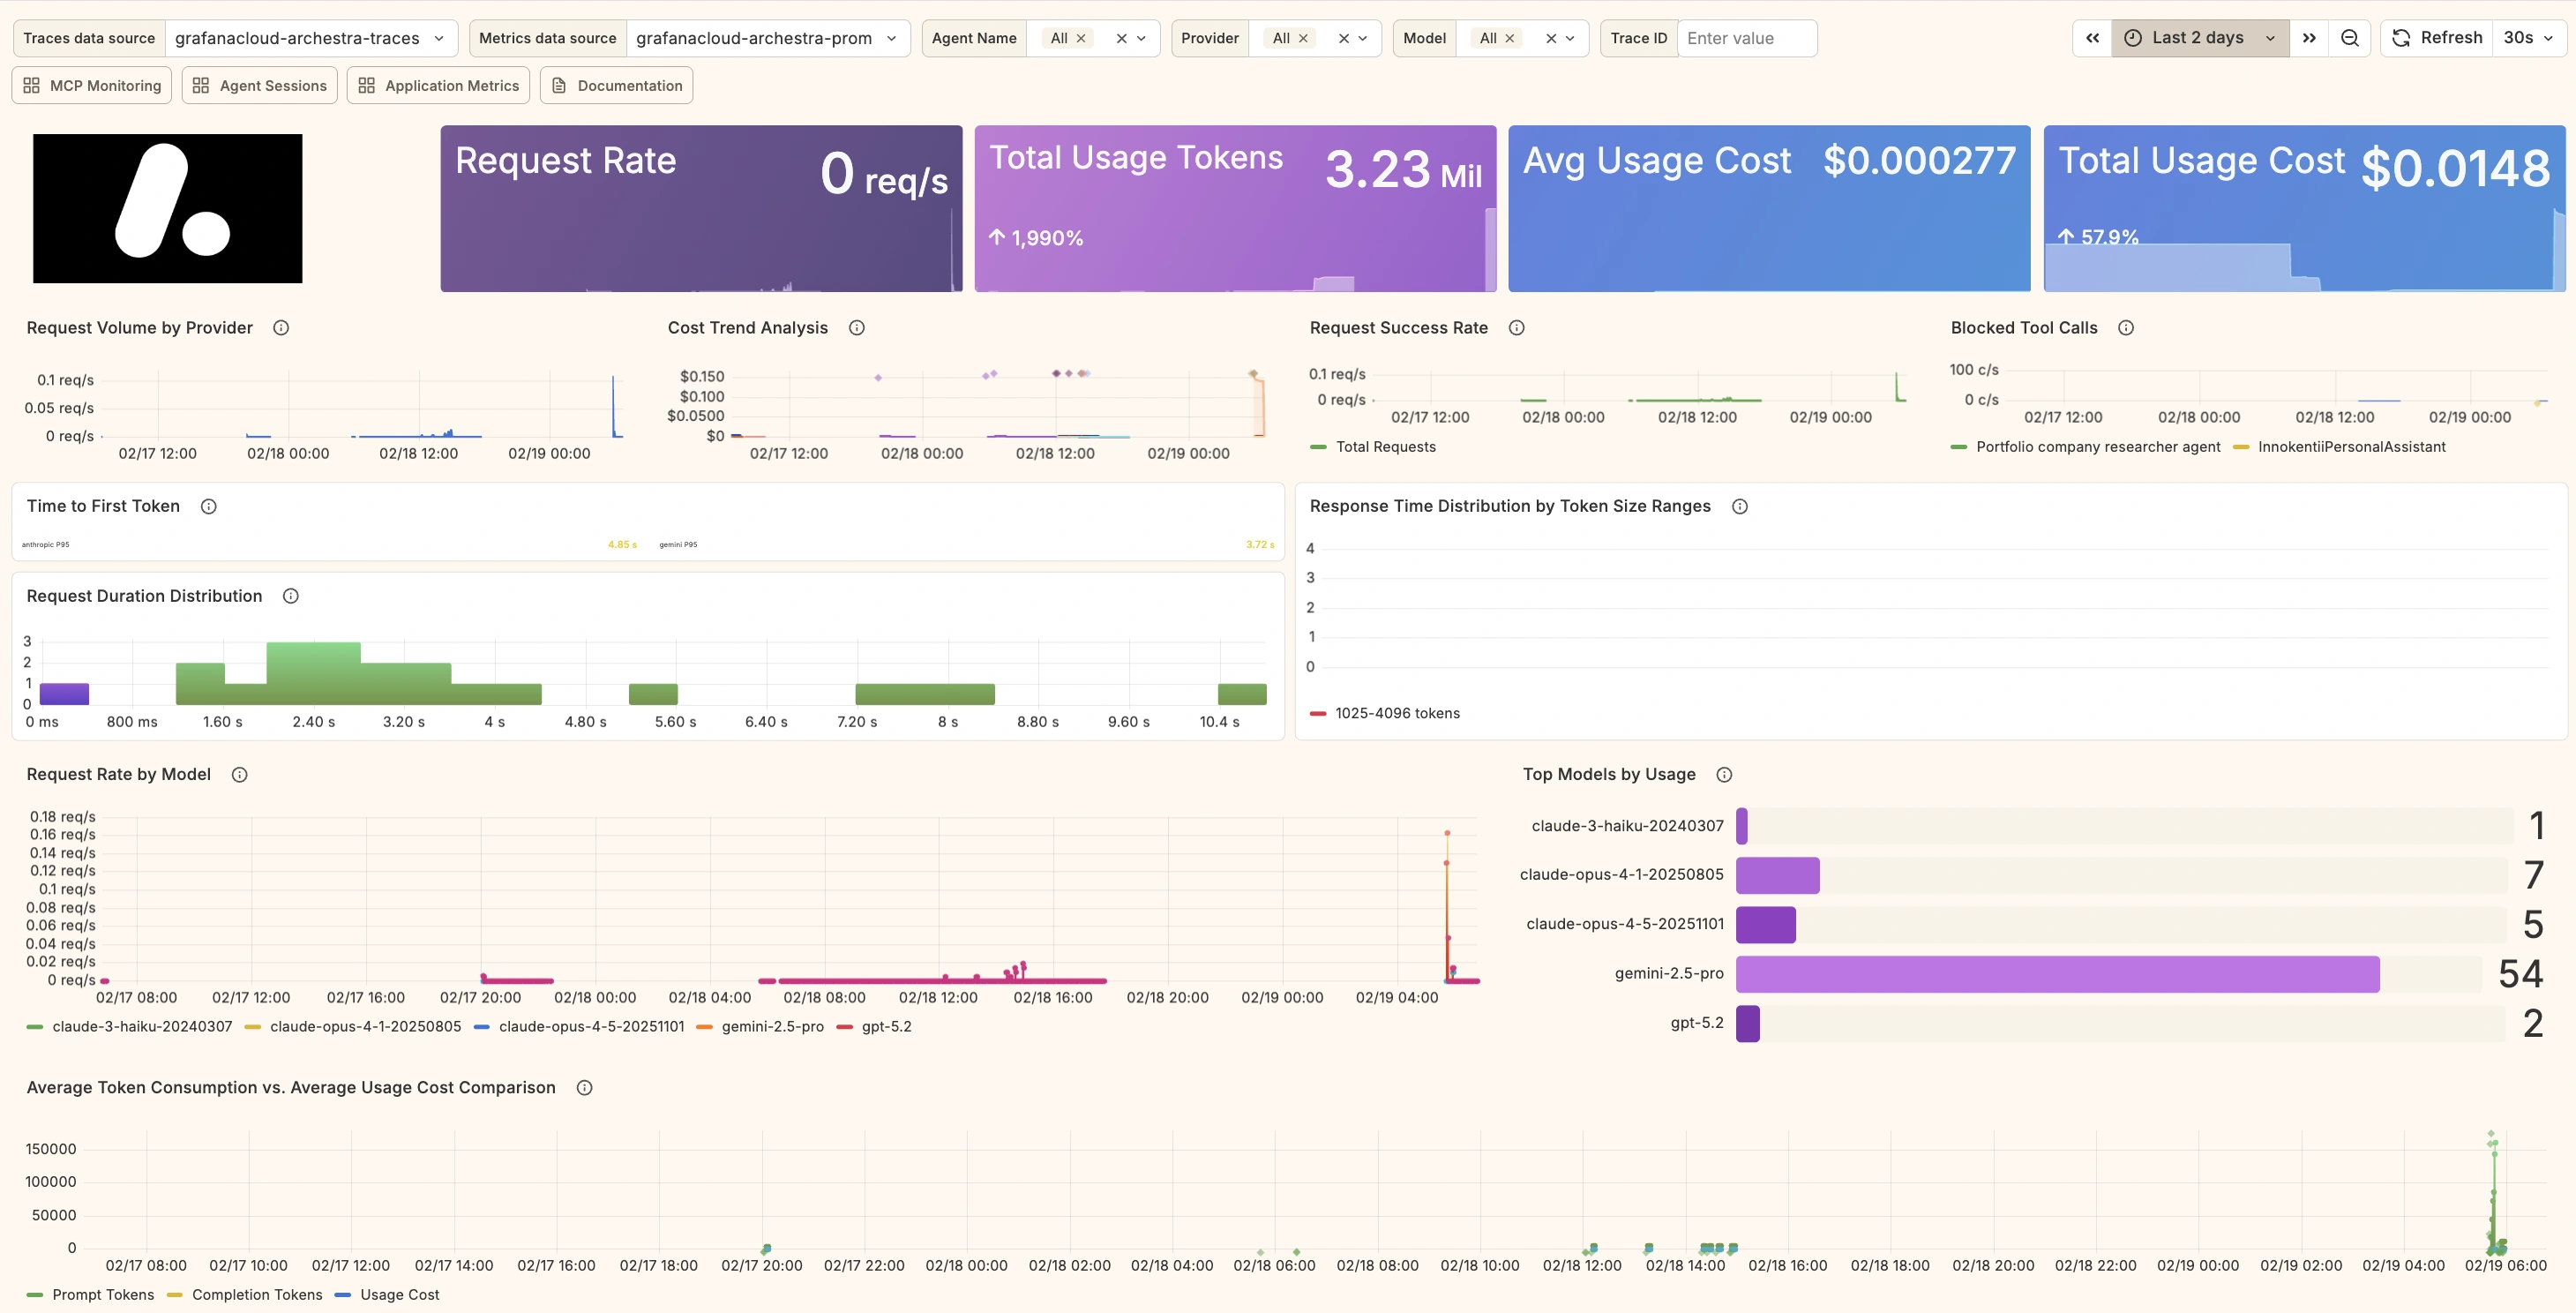
- GenAI Observability — LLM request metrics, token usage, cost analysis, latency, and traces
- MCP Monitoring — MCP tool call metrics, error rates, duration, and traces
- Agent Sessions — Session-level agent audit trail with drill-down into LLM calls, MCP tool calls, and correlated logs
- Application Metrics — HTTP traffic, Node.js runtime health, task queue processing, and PostgreSQL database monitoring
- RAG & Knowledge Base — Connector sync monitoring, embedding pipeline, and RAG query performance
To install all five dashboards at once, create a Grafana Service Account token with the Editor basic role, or the fixed:folders:writer RBAC role for more granular access, and run:
GRAFANA_URL=https://your-grafana-instance GRAFANA_TOKEN=glsa_xxx \
  bash <(curl -sL https://raw.githubusercontent.com/archestra-ai/archestra/main/platform/dev/grafana/install-dashboards.sh)
This creates an "Archestra" folder and imports all dashboards. The script is idempotent — safe to re-run after updates to create new dashboards or update existing ones.
PostgreSQL Metrics Provider
The Application Metrics dashboard includes PostgreSQL panels. By default, it uses metric names from the Bitnami postgres_exporter sidecar (Helm subchart). If your PostgreSQL metrics come from a different source, use the --postgres-provider flag:
# OTel Collector PostgreSQL Receiver (works with RDS, Cloud SQL, Azure, or any PostgreSQL)
GRAFANA_URL=https://example.grafana.net GRAFANA_TOKEN=glsa_xxx \
  bash <(curl -sL https://raw.githubusercontent.com/archestra-ai/archestra/main/platform/dev/grafana/install-dashboards.sh) \
  --postgres-provider otel

# GCP Cloud SQL via Stackdriver Exporter
GRAFANA_URL=https://example.grafana.net GRAFANA_TOKEN=glsa_xxx \
  bash <(curl -sL https://raw.githubusercontent.com/archestra-ai/archestra/main/platform/dev/grafana/install-dashboards.sh) \
  --postgres-provider cloudsql

# Azure Database for PostgreSQL via Azure Monitor
GRAFANA_URL=https://example.grafana.net GRAFANA_TOKEN=glsa_xxx \
  bash <(curl -sL https://raw.githubusercontent.com/archestra-ai/archestra/main/platform/dev/grafana/install-dashboards.sh) \
  --postgres-provider azure
| Provider | Metric Prefix | Use When |
|---|---|---|
helm (default) | pg_* | Using the Bitnami PostgreSQL Helm subchart with metrics sidecar |
otel | postgresql_* | Using OTel Collector PostgreSQL Receiver against any PostgreSQL instance |
cloudsql | stackdriver_cloudsql_* | Scraping GCP Cloud Monitoring via the Stackdriver Exporter |
azure | azure_* | Scraping Azure Monitor metrics for Azure Database for PostgreSQL |