
Real User Monitoring
Real User Monitoring (RUM) exports how people use the Archestra web UI: sessions, time spent, pages visited, features used, and page performance. Events go to your own OTLP collector as log records. Build adoption dashboards from them in Grafana, Splunk Observability, or any backend that reads OTLP logs. RUM is an Enterprise feature.
Setup
Prerequisite: an active Enterprise license. The backend refuses to start when RUM is configured without one.
-
Set the collector's base URL. Archestra appends
/v1/logs.bashARCHESTRA_RUM_EXPORTER_OTLP_ENDPOINT=http://otel-collector:4318 -
If the collector needs credentials, set
ARCHESTRA_RUM_EXPORTER_OTLP_AUTH_BEARER, or bothARCHESTRA_RUM_EXPORTER_OTLP_AUTH_USERNAMEandARCHESTRA_RUM_EXPORTER_OTLP_AUTH_PASSWORD. -
Restart the backend. It logs
RUM export pipeline initialized. -
Sign in and open a few pages. Events arrive at your collector under the service name
Archestra Web.
RUM and trace export have separate settings, so each can use its own collector and credentials. Browsers send events through the Archestra backend. They never need network access to your collector.
Volume Controls
| Variable | Effect |
|---|---|
ARCHESTRA_RUM_SAMPLE_RATE | Fraction of sessions to record, 0 to 1. Whole sessions are kept or dropped. Client errors are always sent. |
ARCHESTRA_RUM_INGEST_MAX_BATCHES_PER_MINUTE | Event batches one user may send per minute (default 120). Events over the limit are dropped. |
ARCHESTRA_RUM_EXPORTER_MAX_QUEUE_SIZE and the other ARCHESTRA_RUM_EXPORTER_* batch settings | Export batching. Raise the batch size and lower the delay for thousands of concurrent users. |
Events
Each event is an OTLP log record with event.name, session.id, and user.id. A session ends after 30 minutes without activity.
session.start: A new session.archestra.session.heartbeat: One per minute while the tab is visible. Count them for minutes of active use.archestra.page_view: A page visit.url.pathis the route pattern, with IDs replaced by:id.archestra.page_load: Time to first byte, DOM ready, and full load.browser.web_vital: A Core Web Vital (LCP, CLS, INP, FCP, or TTFB) with its value and rating.archestra.long_task: A main-thread task over 50 ms.archestra.api_request: An API call: method, route pattern, status code, and duration.archestra.client_error: An uncaught error: its type and a grouping fingerprint. Repeats of one error are sent at most once per second.archestra.interaction: A click, submit, or key press: the event type, the element's tag, and its test ID.archestra.*feature events: Feature use, for examplearchestra.message_sent,archestra.mcp_server_installed, orarchestra.skill_created.
Events never contain chat content, emails, names, full URLs, entity IDs, element text, typed keys, error messages, stack traces, or browser and device details. user.id is an opaque Archestra user ID. Join it to your identity provider's records to see who it is.
Example Queries
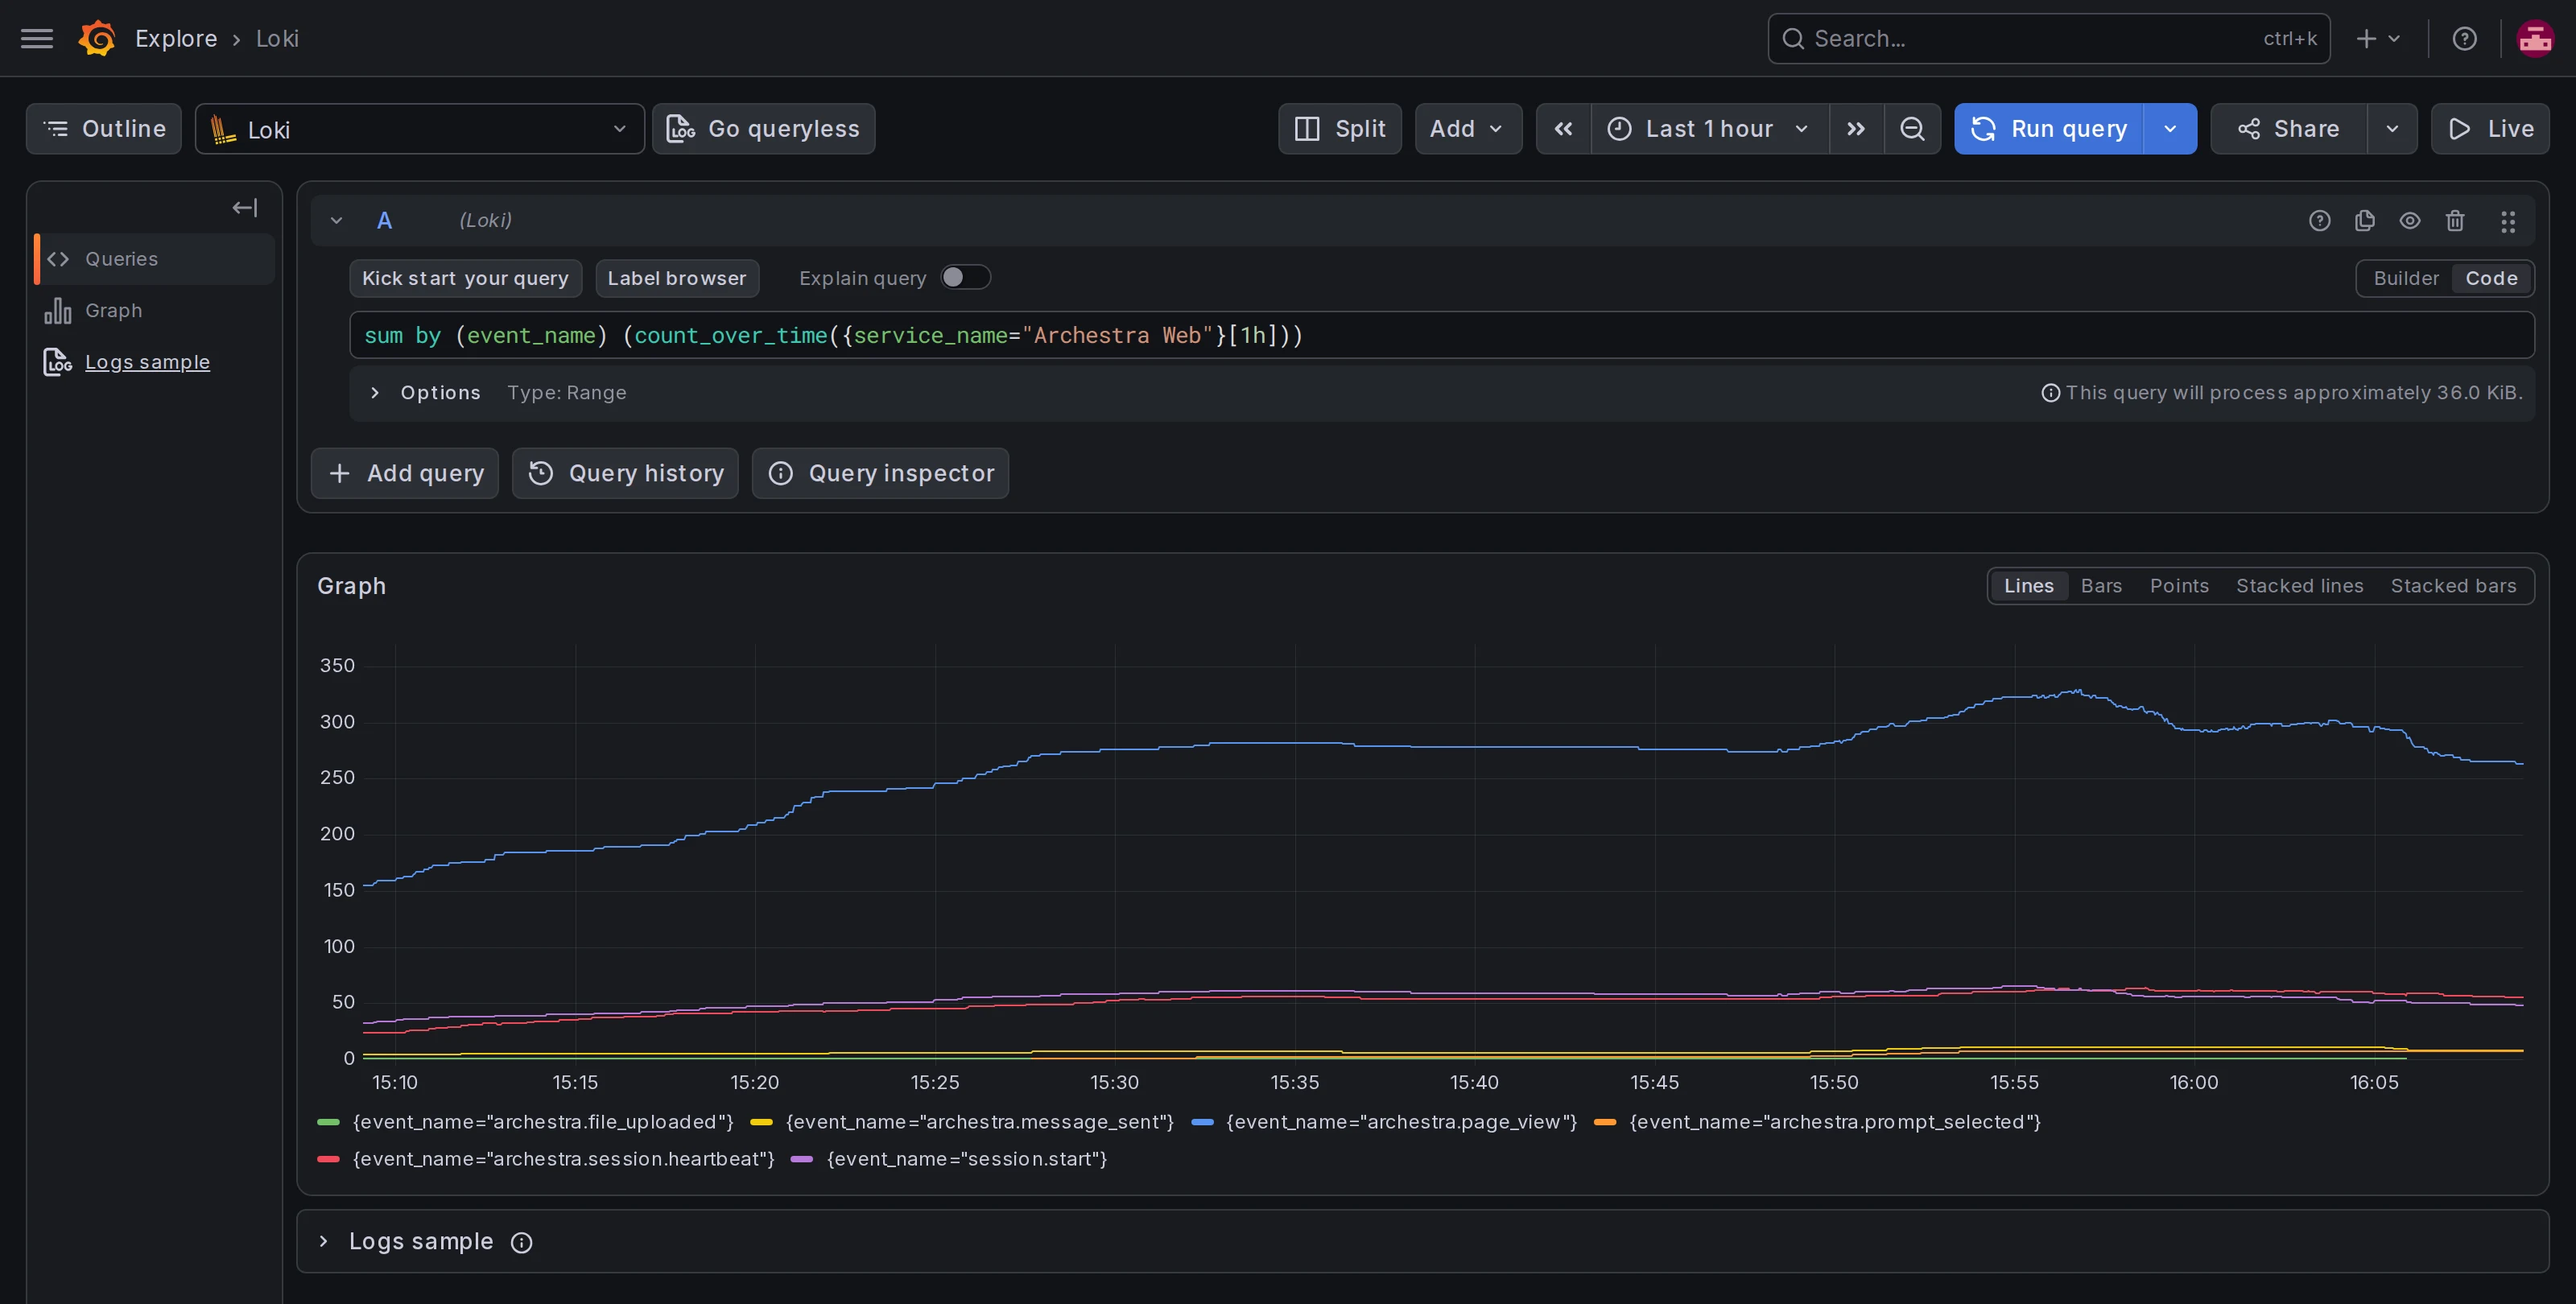
In Grafana with Loki, the event_name field is structured metadata:
# Event counts per hour, by event
sum by (event_name) (count_over_time({service_name="Archestra Web"}[1h]))

# Page views only
{service_name="Archestra Web"} | event_name="archestra.page_view"

# Sessions per day
sum(count_over_time({service_name="Archestra Web"} | event_name="session.start" [1d]))

# Minutes of active use per user per day
sum by (user_id) (count_over_time({service_name="Archestra Web"} | event_name="archestra.session.heartbeat" [1d]))